
Finding unnecessary React re-renders is a measurement problem, not a guessing game. The workflow is short: reproduce the slow interaction, watch what re-renders, profile to learn why it rendered, fix the narrowest cause, then re-measure to confirm. Do that and you fix the render that actually matters instead of scattering React.memo across the codebase and hoping.
This is the hands-on companion to the performance problems I see most. Here I'll walk through the exact tools and steps I use to track down excessive re-renders in real apps — a POS with big tables (Zendtri) and a finance app with long lists (Hunter Vault) — and how to tell a re-render problem apart from something React was never going to fix.
Quick summary
- Re-renders aren't automatically bad — you're hunting the excessive or expensive ones.
- Highlight updates in React DevTools for a quick look at what re-renders.
- The Profiler with "record why each component rendered" tells you the cause.
- Log renders with a small hook only for stubborn cases; remove it before shipping.
- Fix the narrowest cause the profiler points at, then re-measure.
- With React Compiler, many of these fix themselves — profile before hand-memoizing.
First, is a re-render even the problem?
React renders are usually cheap. A component re-rendering isn't a bug by itself — the DOM only updates where something actually changed, and most renders cost microseconds. The goal isn't zero renders; it's finding the renders that are either very frequent (firing on every keystroke or scroll) or very expensive (doing heavy work each time). Chasing every render is how people waste an afternoon making code more complex for no measurable gain. So the first question is always: is this interaction actually slow, and is a re-render the reason?
The rest of this is the loop I run to answer that:
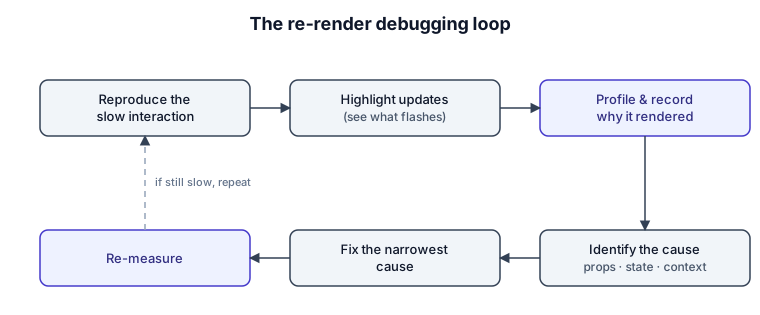
Step 1: See what's re-rendering
Open React DevTools, go to the Components tab settings, and turn on "Highlight updates when components render." Now interact with the page. Every component that re-renders flashes an outline, and the colour hints at how often. It's a crude tool, but it's fast, and it immediately surfaces the obvious problems — a whole table flashing when you type in an unrelated search box, or a sidebar re-rendering on every keystroke somewhere else entirely.
Use this as a first pass to find where to look, not to diagnose. It tells you something re-renders too much; the next step tells you why.
Step 2: Profile and record why
Switch to the Profiler tab. In its settings, enable "Record why each component rendered while profiling." Record a short session while you perform the slow interaction, then stop.
The ranked chart shows which components rendered and how long each took, so you can go straight to the expensive ones. Click a component and DevTools shows why it rendered: props changed, hooks changed, state changed, or the parent re-rendered. That single line is the whole point of profiling — it turns "this re-renders a lot" into "this re-renders because its config prop is a new object every time," which is something you can actually fix.
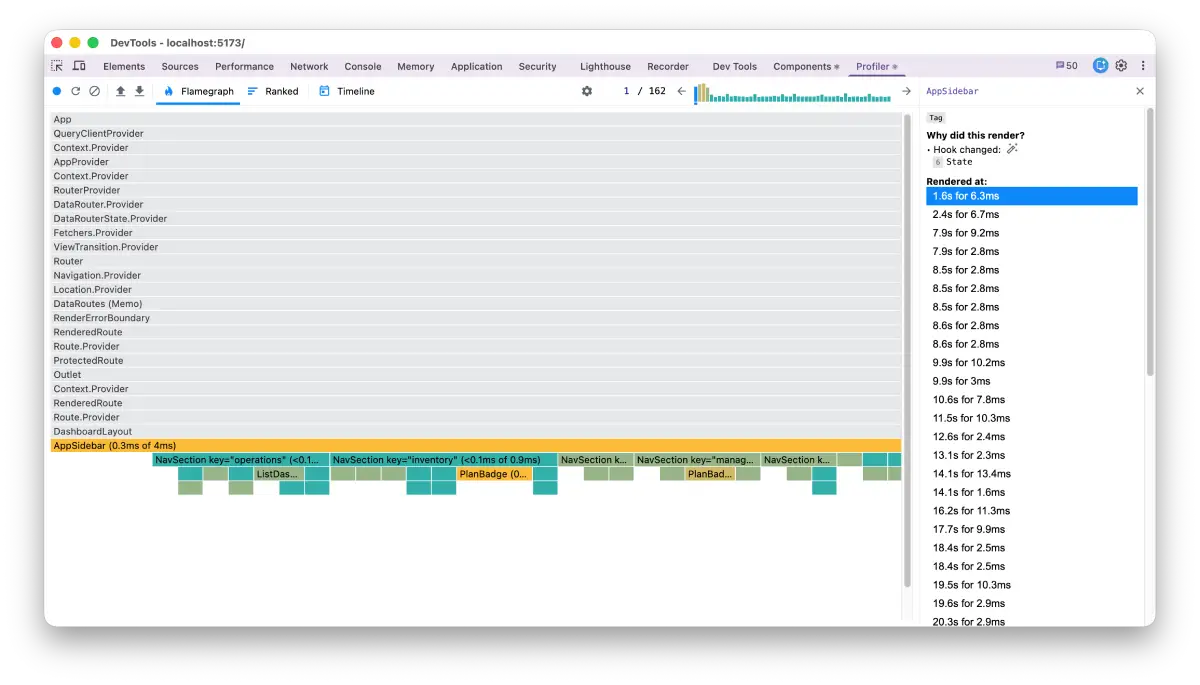
AppSidebar in Zendtri re-rendered 162 times in a single session. The Profiler pinpoints the cause immediately: a state hook firing on changes the sidebar doesn't actually use.
Step 3: Confirm it in context
A re-render only matters if it's where the time goes. React 19.2's performance tracks put React's own work into Chrome DevTools' Performance panel, lined up next to network requests and JavaScript execution. That lets you check whether the jank you're chasing is really rendering — or whether the render is trivial and the real cost is a slow request or a heavy script running at the same moment. It's the difference between fixing the problem and polishing something that was never slow.
Step 4: Log renders for stubborn cases
DevTools covers most of it, but sometimes you want a render count or a diff in the console. Two small debug hooks I reach for:
// counts how many times a component renders (debug only)
function useRenderCount(label: string) {
  const count = useRef(0);
  count.current += 1;
  console.log(`${label} render #${count.current}`);
}
// logs which props changed between renders (debug only)
function useWhyDidYouUpdate(name: string, props: Record<string, unknown>) {
  const prev = useRef<Record<string, unknown>>();
  useEffect(() => {
    if (prev.current) {
      const changed: Record<string, [unknown, unknown]> = {};
      for (const key of Object.keys({ ...prev.current, ...props })) {
        if (prev.current[key] !== props[key]) {
          changed[key] = [prev.current[key], props[key]];
        }
      }
      if (Object.keys(changed).length) {
        console.log(`[why-update] ${name}`, changed);
      }
    }
    prev.current = props;
  });
}
These are debugging aids, not production code — pull them out once you've found the cause. If you'd rather not hand-roll them, the why-did-you-render library does the same job. But reach for logging only when the Profiler hasn't already made the answer obvious.
Step 5: Fix the narrowest cause
The profiler told you the cause; match it to the fix and change only that:
| What the profiler shows | Likely cause | Fix |
|---|---|---|
| "Parent rendered" + memoized child | Unstable prop (new object/fn each render) | Stabilize the reference (or let React Compiler handle it) |
| "Props changed" for a stable-looking prop | New object/array/function created in render | useMemo / hoist it out |
| "Hooks changed" on unrelated updates | Over-broad context or store subscription | Narrow the subscription; split the context |
| Whole subtree renders on one change | State lives too high in the tree | Move the state down to where it's used |
Notice these all point back to state placement — which is why choosing state management prevents most of them in the first place. Fix the specific cause; resist the urge to memoize everything nearby "just in case."
Step 6: Re-measure
Record the interaction again and confirm two things: the render you were chasing is gone, and the interaction is actually faster. If the render is gone but it's still slow, the cause was somewhere else — back to profiling. This is the step people skip, and it's the one that stops you from shipping an "optimization" that didn't change anything.
A note on React Compiler
Before you hand-memoize anything, check whether you even need to. React Compiler 1.0 (stable) automatically applies memoization to components and hooks, which eliminates a large share of the unstable-reference re-renders that used to require useMemo and useCallback. The manual APIs are still useful as escape hatches for the cases where you need precise control, but the default in 2026 is to write plain code, let the compiler handle the routine cases, and profile to find the ones it doesn't.
Tradeoffs
The trap in this topic is treating every re-render as a defect. It isn't, and eliminating cheap renders costs you readability and time for no real speedup. The discipline is to measure, fix the renders that are demonstrably frequent or expensive, and stop. Debug hooks add console noise and should never ship. And more memoization is not automatically better — each comparison has a cost, and a codebase dense with memo is harder to reason about than one that's fast where it needs to be.
FAQs
Are re-renders always bad?
No. Most are cheap, and React only touches the DOM where something changed. You're looking for renders that are very frequent or do heavy work — not trying to reach zero.
How do I know why a component re-rendered?
Use the Profiler with "record why each component rendered" enabled; it names the reason (props, hooks, state, or parent). For a closer look, a small useWhyDidYouUpdate hook logs exactly which props changed between renders.
Does React.memo fix everything?
No. React.memo only helps when a component's props are stable and re-rendering is the actual cost. It won't speed up a huge list (that needs virtualization) and it does nothing if the props change every render anyway.
Do I still need to do this with React Compiler?
Yes, but less often. The compiler removes many routine re-renders automatically, so you'll hand-memoize far less. You still profile to find real bottlenecks — and the compiler doesn't touch network or bundle costs, which are frequently the real problem.
Fighting a React app that re-renders too much? See how I help teams design and build production React applications →
Related: common React performance problems I find in production · how to choose state management for a React app · the React hub