

Most React performance problems come down to a handful of repeat offenders, and almost none of them are "React is slow." The recurring causes I see in production apps are components subscribing to too much state, expensive work happening during render, unstable references, and lists or tables that render far more than they need to. Fix those and the "React feels sluggish" complaint usually disappears.
Before any of it, though: measure first. The most expensive performance work I've seen is time spent optimizing the wrong thing. This guide walks through the problems I run into most, shows before-and-after code for the common ones, and — just as important — points out when the bottleneck isn't React at all. The examples come from real apps: a multi-tenant POS with large product and transaction tables (Zendtri) and an offline-first finance app with long lists and local database queries (Hunter Vault).
Quick summary
- Measure before optimizing — the profiler tells you where time actually goes.
- The usual culprits: over-subscribed state, expensive render-time work, unstable references, big lists/tables.
- Prefer structural fixes (virtualize, paginate, split, cache) over sprinkling
useMemoeverywhere. - React Compiler now applies most rote memoization for you; manual memo APIs are escape hatches.
- Some slowdowns aren't React — bundle size, images and network waterfalls need different fixes.
The problems I see most
Here's the shortlist, with the symptom that gives each one away and the fix I reach for:
| Problem | Symptom | Fix |
|---|---|---|
| Over-subscribed state | Components re-render on unrelated changes | Subscribe to the narrowest slice; split context or use store selectors |
| Expensive work in render | Jank while typing or scrolling | Memoize the calculation; move work out of render |
| Unstable object/function refs | Memoized children re-render every parent render | Stabilize the references (or let React Compiler handle it) |
| Large tables / lists | Slow scroll, long mount time | Virtualize (render only visible rows); paginate |
| Excessive or wrong effects | Extra renders, flicker, loops | Derive instead of using an effect; fix dependencies |
| Duplicate requests | The same data fetched repeatedly | Cache in a server-state layer; dedupe |
| Broad context updates | One change re-renders a whole subtree | Split providers; move volatile state to a store |
| Rendering hidden content | Work done for off-screen UI | Defer or mount lazily; render on demand |
| Heavy bundle | Slow first load | Code-split by route/feature; drop heavy dependencies |
| Unoptimized images | Slow load, layout shift | Right-size and lazy-load images |
| Slow local / DB queries | Laggy interactions, especially offline | Index and narrow queries; paginate results |
Expensive work and unstable references
Two of these travel together, so I'll show them at once. Here, a total is recomputed on every render even when the data hasn't changed, and a config object is recreated each render — which quietly re-renders any memoized child that receives it:
function Dashboard({ transactions }) {
  // recomputed on every render, even when transactions didn't change
  const totals = transactions.reduce(computeTotals, emptyTotals);

  // new object identity every render -> memoized children re-render
  const config = { currency: "PHP", locale: "en-PH" };

  return <Summary totals={totals} config={config} />;
}
The fix is to make the expensive value and the reference stable:
function Dashboard({ transactions }) {
  const totals = useMemo(
    () => transactions.reduce(computeTotals, emptyTotals),
    [transactions]
  );

  const config = useMemo(() => ({ currency: "PHP", locale: "en-PH" }), []);

  return <Summary totals={totals} config={config} />;
}
Worth knowing in 2026: with React Compiler enabled, most of this manual memoization is applied for you automatically, so you write the plain version and the compiler inserts the equivalent of useMemo/useCallback where it helps. I still reach for the manual APIs as escape hatches in the specific cases where I need precise control, but they're no longer something to sprinkle everywhere by default.
Over-subscribed state
This is the one I find most often, and it ties directly to how you manage state (I go deep on that in choosing state management). The pattern: a component reads far more state than it uses, so it re-renders whenever anything nearby changes.
With Context, the usual cause is one big provider whose value is a fresh object each render, re-rendering every consumer:
// value changes identity each render -> every consumer re-renders
<AppContext.Provider value={{ user, theme, notifications }}>
  {children}
</AppContext.Provider>
Splitting the context so unrelated concerns update independently — and keeping each value stable — cuts most of it:
<UserContext.Provider value={user}>
  <ThemeContext.Provider value={theme}>
    {children}
  </ThemeContext.Provider>
</UserContext.Provider>
For state that changes frequently or is read widely, a store with selectors re-renders even less, because a component can subscribe to just the slice it needs rather than the whole value. Either way, the principle is the same: read the narrowest thing you can.
Large lists and tables
This is where a POS like Zendtri and a transaction-heavy finance app like Hunter Vault feel it most. Memoization doesn't help here, because the cost isn't re-rendering — it's rendering thousands of DOM nodes in the first place. The fix is structural: virtualize the list so only the visible rows are in the DOM, and paginate the data so you're not loading everything at once. If a table is slow and you've been adding React.memo to the rows, you're treating the wrong problem.
Measure first — and check it's actually React
Before optimizing anything, profile it. React DevTools' Profiler shows you which components render, how often, and why; and React 19.2's performance tracks line React's work up against network requests and JavaScript execution in the browser's own profiler, so you can see where the time really goes. I cover the hands-on workflow in how to find unnecessary re-renders.
The reason to measure isn't diligence for its own sake — it's that a lot of "slow React" isn't React:
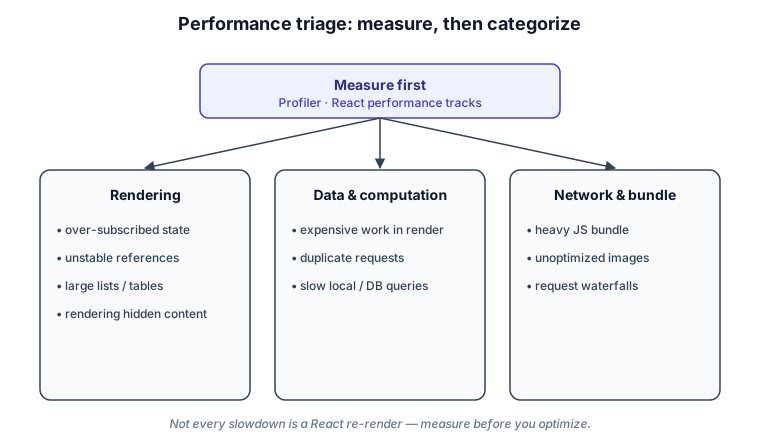
Rendering fixes (memoization, virtualization, narrower subscriptions) do nothing for a bloated bundle, oversized images or a request waterfall. Those are real and common, and they need their own fixes — code-splitting, image handling, and cutting round-trips. It's telling that adopting React Compiler often reveals this: once the re-render noise is gone, the actual bottleneck turns out to be somewhere React was never going to help.
Real-world profiler captures from Zendtri and Hunter Vault — before/after screenshots with actual render timings — will go here when available. Measured numbers make the case for any of these techniques far better than synthetic examples.
Tradeoffs
Optimization isn't free, and the biggest cost is usually complexity you didn't need. Manual memoization scattered everywhere makes code harder to read and can even slow things down through comparison overhead. Virtualization adds moving parts. Splitting context or reaching for a store is more structure to maintain. The right move is to measure, fix the specific thing the profiler points at, and stop — not to apply every technique in this article to every component preemptively.
My recommendation
Measure first, then fix by category: rendering problems get narrower subscriptions and virtualization; computation problems get memoized or moved off the render path; data problems get caching and dedupe; and bundle or network problems get code-splitting and fewer round-trips. Prefer structural fixes over sprinkling memo, let React Compiler handle the rote memoization, and never optimize on a hunch — confirm the bottleneck before you touch it, and confirm the fix afterward.
FAQs
Do I still need useMemo, useCallback and React.memo?
Less by hand than you used to. With React Compiler stable, most components get their memoization applied automatically, so the default is to write plain code. Keep the manual APIs as escape hatches for the cases where you need precise control — that's the subject of a dedicated article in this cluster.
Why is my list still slow after memoizing the rows?
Because memoization prevents re-renders, but a huge list's cost is the sheer number of DOM nodes it mounts. Virtualize it so only the visible rows exist, and paginate the underlying data.
Is Context bad for performance?
Not inherently. The problem is a single broad provider that re-renders a whole subtree on every change. Split providers by concern and keep their values stable, and for frequently-changing state prefer a store with selectors.
How do I know what to optimize?
Profile before you change anything. Guessing is how you end up optimizing code that was never the bottleneck. Let the profiler point at the slow thing, fix that, and measure again.
Got a React app that feels slow? See how I help teams design and build production React applications →
Related: how to find unnecessary React re-renders · how to choose state management for a React app · the React hub